September 2026 market review · Published 15 October 2026 · Analysis by Sean See, based on SRI Research’s monthly developer-sales report.
Singapore’s new private-home sales recovered in September 2026, with developers selling 296 units excluding executive condominiums (ECs), according to the supplied SRI Research report. That is a 93.5% month-on-month increase from August’s 153 units and a 16.1% increase from September 2025’s 255 units.
Including 23 EC sales, the September total reaches 319 units. The distinction matters: 296 is the private-home figure excluding ECs, while 319 includes them. Neither figure measures the entire residential market, including resale transactions.
The recovery also has a useful qualification. September improved from a low August base, but the report still places the first nine months of 2026 below the corresponding period in 2025. Buyers should read the monthly rebound, regional distribution and project-level results together.
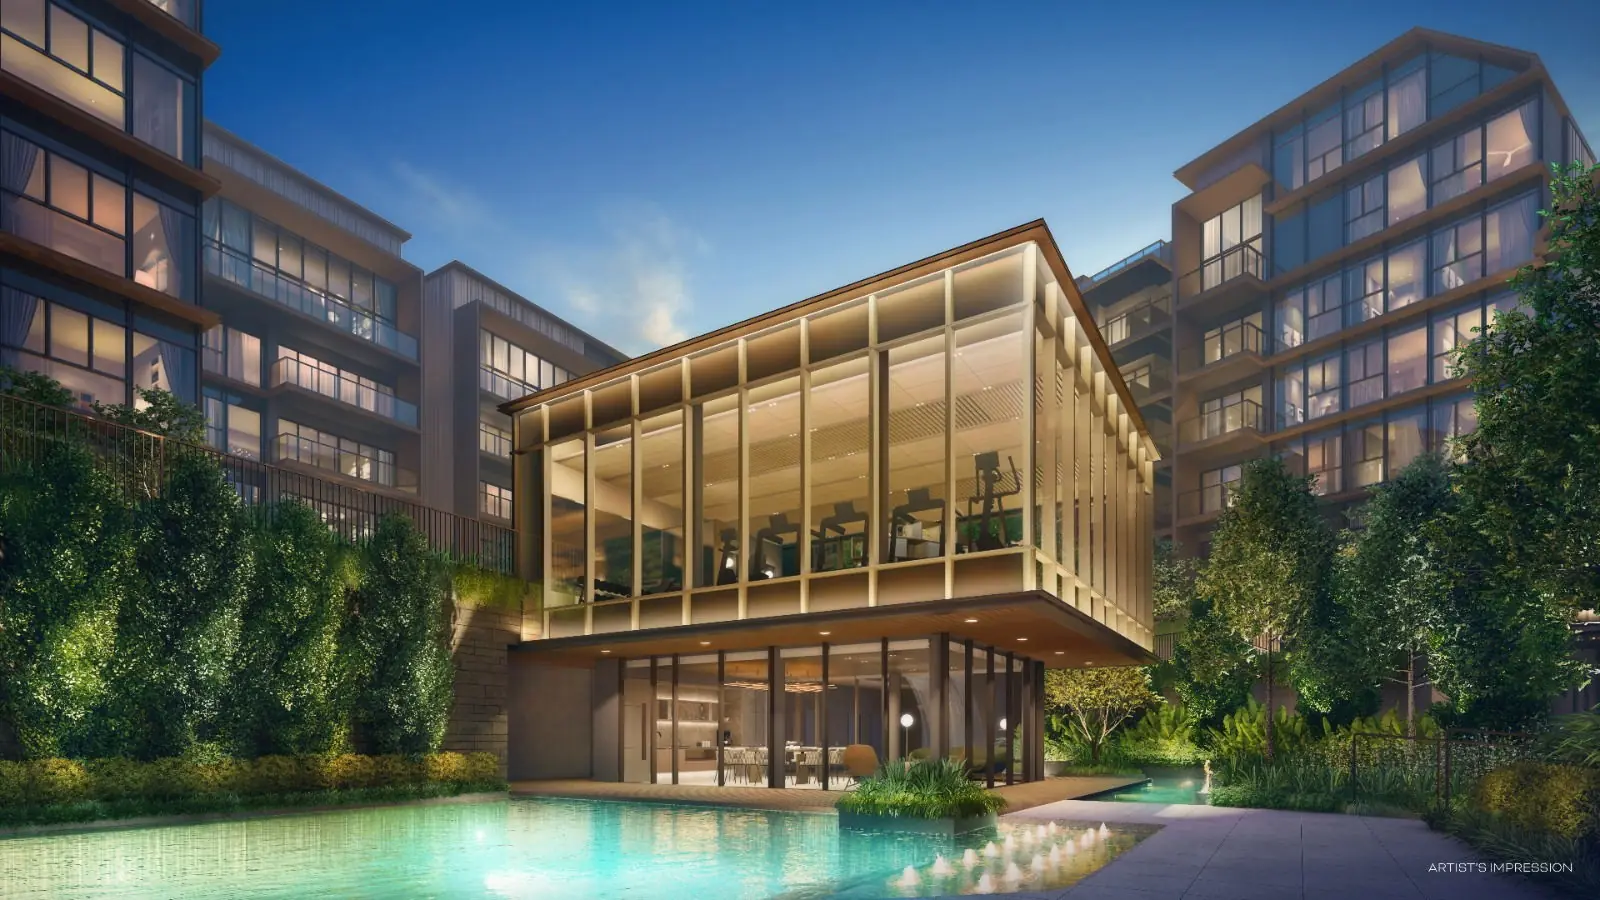
Featured picture: Terra Hill project image from the marketing materials already used on this website. Terra Hill leads the report’s September project-sales table.
September developer sales: the key numbers
| Segment | Aug 2026 | Sep 2026 |
|---|---|---|
| CCR | 24 | 40 |
| RCR | 72 | 131 |
| OCR excluding ECs | 57 | 125 |
| Total excluding ECs | 153 | 296 |
| ECs | 18 | 23 |
| Total including ECs | 171 | 319 |
Including ECs, sales increase 86.5% from August’s 171 units and 18.1% from September 2025’s 270. EC sales themselves rise from 18 to 23 units month on month. Keep the same definition on both sides whenever comparing periods.
A percentage rebound can appear particularly strong after a quiet month. SRI links August’s subdued activity to a light launch calendar and the Hungry Ghost Festival period. September’s improvement should therefore be read as a recovery in recorded transactions, rather than proof that demand nearly doubled independently of available supply.
RCR and OCR account for 86.5% of sales excluding ECs
| Region | Units | Share | MoM change |
|---|---|---|---|
| CCR | 40 | 13.5% | +66.7% |
| RCR | 131 | 44.3% | +81.9% |
| OCR | 125 | 42.2% | +119.3% |
The RCR and OCR contribute 256 of the 296 private-home sales excluding ECs. The RCR has the largest share at 44.3%, narrowly ahead of the OCR’s 42.2%. This shows where September’s recorded sales were concentrated, without establishing that every project in either region experienced the same response.
The OCR records the largest percentage increase from August, rising from 57 to 125 units. The RCR moves from 72 to 131, while the CCR rises from 24 to 40. Year on year, the report shows the CCR 13.0% lower, the RCR 4.8% higher and the OCR 48.8% higher.
For buyers, a regional result is context for a shortlist. It should not replace a comparison of the exact home’s price, layout, location and timing. The same regional label can cover projects with quite different total budgets and everyday uses.
September’s best-selling projects and transaction medians
| Project | Units sold | Median S$/psf | Region |
|---|---|---|---|
| Terra Hill | 32 | 2,209 | RCR |
| The Sen | 25 | 2,386 | RCR |
| Amberwood At Holland | 24 | 3,021 | CCR |
| Lentor Gardens Residences | 22 | 2,348 | OCR |
| Union Square Residences | 21 | 2,813 | RCR |
| Coastal Cabana (EC) | 19 | 1,811 | OCR / EC |
| Luxus Hills | 18 | 3,455 | OCR |
| The Continuum | 16 | 2,716 | RCR |
| Chuan Park | 10 | 2,708 | OCR |
| Dunearn House | 10 | 3,105 | CCR |
Terra Hill leads with 32 units at a September median of S$2,209 psf, followed by The Sen with 25 units at S$2,386 psf. Together, their 57 sales account for approximately 19.3% of the 296-unit total excluding ECs, calculated from the report.
Amberwood At Holland follows with 24 units at a median of S$3,021 psf. Lentor Gardens Residences records 22 units at S$2,348 psf, and Union Square Residences records 21 at S$2,813 psf. These are the report’s September transaction medians, not current quotations or advertised starting prices.
SRI notes that only part of Amberwood’s inventory was released at its initial launch. A sales count should therefore be read alongside the number and types of homes made available. Raw volumes alone do not show a comparable take-up rate across developments.
How buyers should use the median PSF figures
A transaction median is the middle observation in the relevant set of recorded transactions. It is useful for understanding that month’s sales, but it is not a price list for every apartment in the development. The homes transacted may differ in size, floor, facing and layout from the units still available.
The table also brings together different property products and unit mixes. A lower median psf does not automatically mean a lower total purchase commitment or better value. Compare similar homes, then add renovation or furnishing, occupation timing and the practical space delivered.
For example, a buyer reviewing The Continuum, Chuan Park or Dunearn House should obtain a current stack-specific quotation. Use the floor-plan guide to check usable space and furniture clearance rather than applying a monthly project median to a different unit.
Previously launched projects still contribute
The report describes September as a month with limited fresh project inventory for much of the period, with Amberwood entering near its end. Sales at other developments therefore matter to the reading of the month: activity was not confined to a single new launch.
For a buyer, an existing launch can offer a different decision process from an opening weekend. There may be more time to compare actual available stacks, specifications and payment timing. That can be useful, while the remaining choices still need to be checked rather than inferred from a sales ranking.
Coastal Cabana records 19 EC sales at a median of S$1,811 psf in the report. Its EC classification should be retained when comparing it with private developments. Confirm the applicable purchase requirements before treating an EC and a private condo as interchangeable options.
The year-to-date picture remains below 2025
SRI reports 5,334 new private-home sales excluding ECs in the first nine months of 2026, compared with 7,875 over the same period of 2025. That is approximately 32.3% lower, calculated from the report’s figures. A better September therefore does not, by itself, reverse the year-to-date gap.
SRI interprets the lower volume partly through the timing and availability of new projects. That is the research team’s interpretation; the sales totals alone cannot isolate how much of the difference comes from supply, buyer preferences, pricing or other influences.
The report notes that the figures may be revised after the next quarterly statistics release. URA’s data release calendar schedules the Q3 2026 market update for 23 October. Readers should refresh comparisons when the fuller data is available.
Q4 outlook: more choice, with forecasts kept separate
SRI’s report forecasts approximately 7,000–8,000 new private-home sales for full-year 2026, excluding ECs. This is a research forecast, not a confirmed outcome. Against its reported nine-month total of 5,334, that range would require 1,666–2,666 sales in the final quarter; those additional figures are arithmetic, not a separate prediction.
The report highlights Lucerne Grand, The Serra Residences and Thomson Reserve as projects relevant to the fourth-quarter pipeline. Actual sales will depend on what launches, when homes become available and how buyers respond to the specific products and prices.
For context, read the Lucerne Grand launch-results analysis and the Serra preview and guide-price update. Treat dated launch announcements and guide prices as dated information, and obtain the current sales materials before committing.
Sean’s buyer takeaway
My reading is that September shows a recovery in recorded developer sales, supported by several projects, while the larger 2026 picture remains sensitive to the launch calendar. The useful next step is a disciplined comparison of available homes, rather than assuming that one strong monthly percentage makes every purchase urgent.
Set a total budget, identify the layouts that fit the household, and compare two or three realistic alternatives. Use the property affordability calculator to organise the budget and the new-launch buyer checklist to keep the comparison consistent. Confirm financing and the exact quotation separately.
If a sale is part of the move, plan the proceeds and timing through Sell with Sean. Compare resale homes with new launches, and read the Q3 private-property price update alongside the sales-volume picture. Price indices and developer-sales counts measure different things.
Frequently asked questions
Were September sales 296 or 319 units?
The SRI report records 296 new private homes excluding ECs and 319 including 23 EC sales. State the definition whenever quoting the total.
Can I buy at the median PSF shown in the table?
The medians describe September transactions. They do not establish the current price or availability of a particular unit. Ask for a written quotation for the selected stack and floor.
Does the 7,000–8,000 full-year range include ECs?
No. SRI’s forecast excludes ECs, and the range remains a forecast rather than a completed sales result.
Sources, definitions and related updates
Primary source: SRI Research, Monthly Developer Sales Insights — September 2026, supplied for this article and prepared by Mohan Sandrasegeran, Head of Research & Data Analytics. The report credits SRI Research and URA REALIS for its sales and project-level tables. Monthly figures, transaction medians and the outlook above are attributed to that report; the decision-making commentary is Sean’s analysis.
Additional calculations are identified in the text. Project medians relate to September 2026 and are not live prices. Forecasts and expected launch activity may change. The report’s figures have not been independently reproduced from the underlying REALIS records.
For shorter-period context, see the weekly project-sales updates for 28 September–4 October and 5–11 October. Those supplied compilations have different periods and coverage; they should not be added together to reconstruct September’s monthly developer-sales total.