Reporting period: 5–11 October 2026. Published 12 October 2026. Analysis by Sean See.
The supplied weekly project-sales compilation for 5–11 October 2026 records 63 residential units. The Rest of Central Region (RCR) contributes 27 units, the Outside Central Region (OCR) 26 and the Core Central Region (CCR) ten. A further two units are recorded under commercial and industrial projects, making 65 units across all categories in this compilation.
Lucerne Grand has the largest individual residential count with 11 units, followed by Union Square Residences with seven. Unlike the previous week, when Lucerne Grand dominated the total, this week’s recorded sales are less concentrated in a single project.
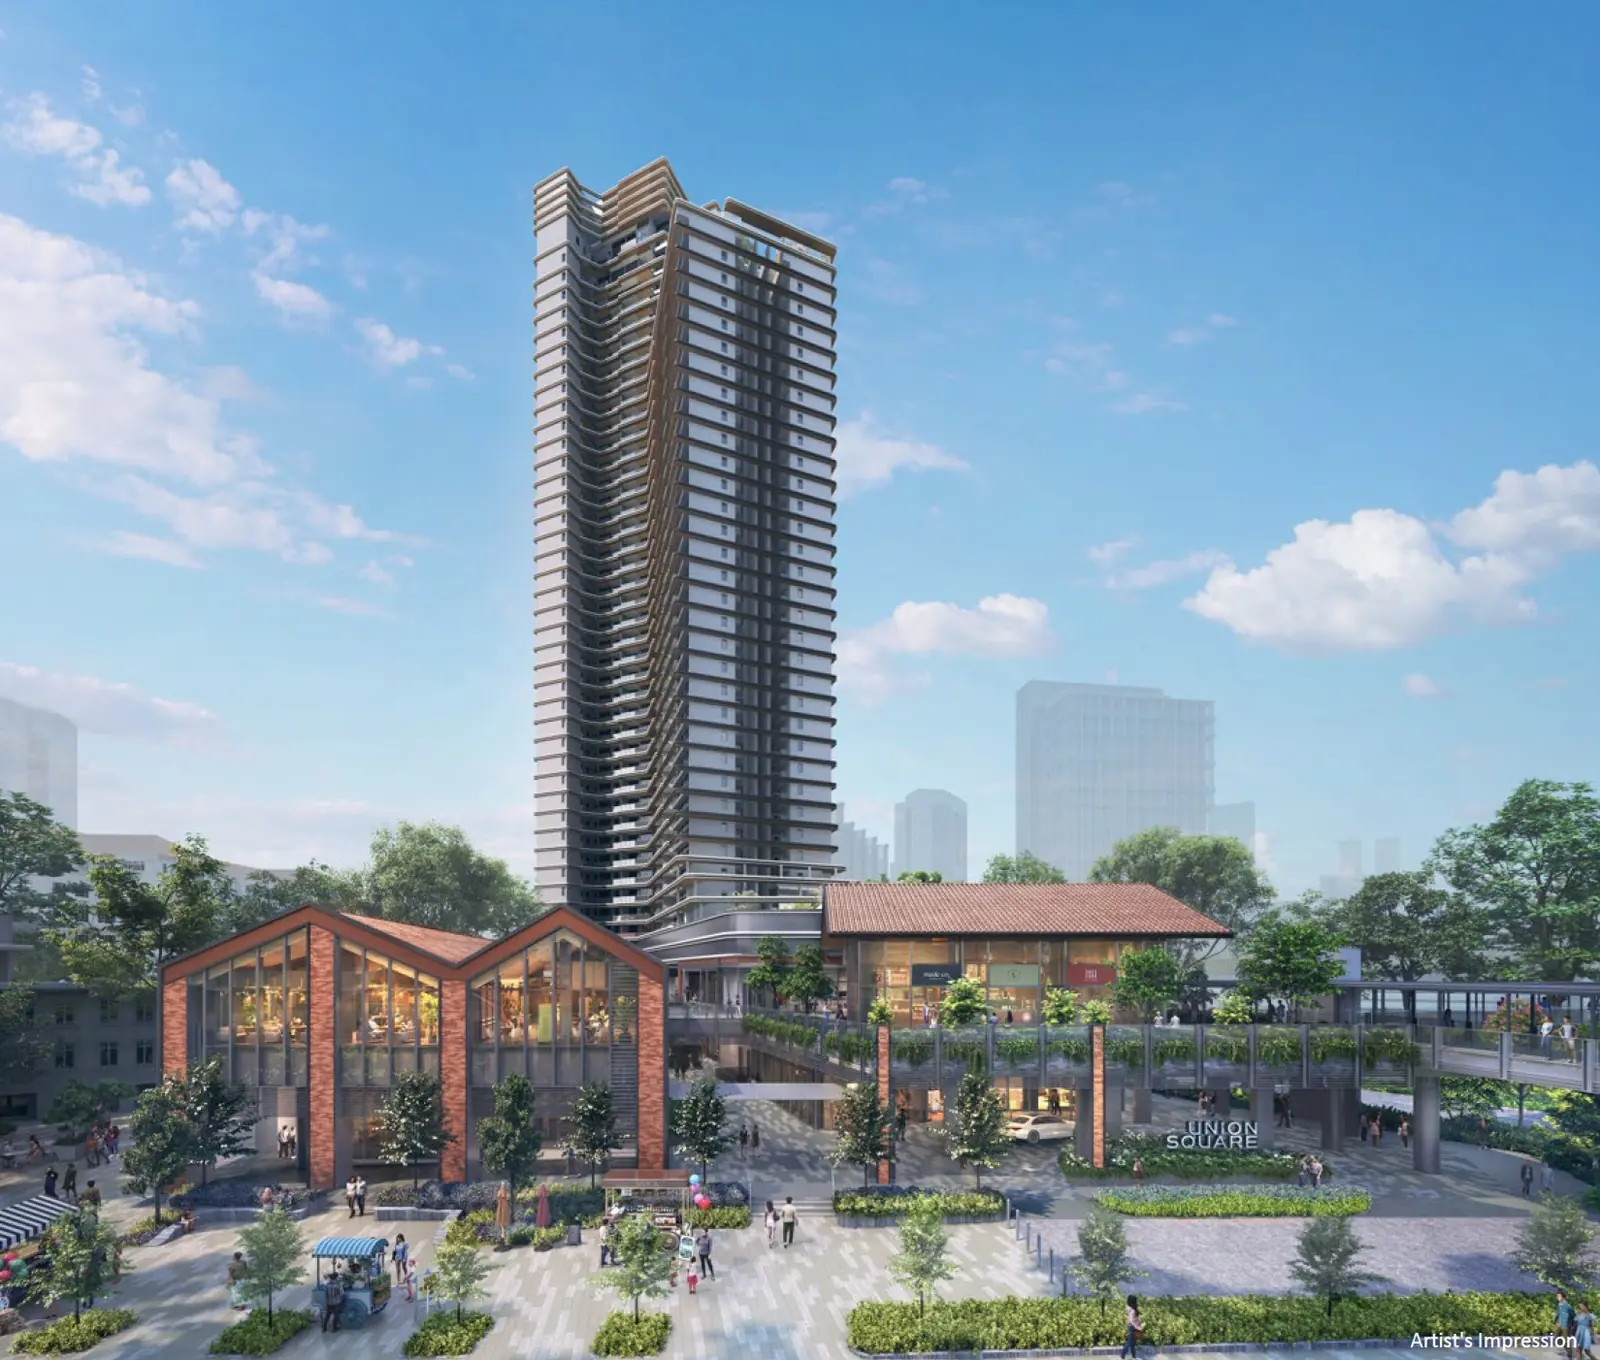
Featured picture: Union Square Residences project image, reused from its existing project page on this website. The development leads this week’s RCR tally.
Weekly sales at a glance
| Market region | Units | Share of residential total |
|---|---|---|
| Core Central Region (CCR) | 10 | 15.9% |
| Rest of Central Region (RCR) | 27 | 42.9% |
| Outside Central Region (OCR) | 26 | 41.3% |
| Residential total | 63 | 100% |
Percentages are rounded and may not add to exactly 100%. The two commercial and industrial units are additional to the 63 residential units. These figures describe the supplied project list, rather than every property transaction in Singapore.
Why 63 versus 401 needs a closer look
The residential headline is 338 units lower than the 401 recorded in the previous weekly sales article for 28 September–4 October. Taken on its own, that comparison looks dramatic. However, Lucerne Grand’s count changes from 348 in the previous compilation to 11 in this one, a difference of 337 units.
Excluding Lucerne Grand from both lists leaves 53 residential units in the previous week and 52 this week. Almost all of the change in the headline therefore comes from that project’s contribution to the two snapshots. The comparison describes the arithmetic of the supplied lists; it does not establish a fall of the same size in market-wide demand.
| Measure | 28 Sep–4 Oct | 5–11 Oct | Change |
|---|---|---|---|
| Residential total | 401 | 63 | −338 |
| Lucerne Grand | 348 | 11 | −337 |
| Residential total excluding Lucerne Grand | 53 | 52 | −1 |
| CCR | 4 | 10 | +6 |
| RCR | 25 | 27 | +2 |
| OCR excluding Lucerne Grand | 24 | 15 | −9 |
| Commercial and industrial | 2 | 2 | 0 |
The project rosters differ between weeks, and the original compilations’ coverage and transaction definitions have not been independently verified. The 53-to-52 comparison should therefore not be described as proof that like-for-like demand was unchanged. It is useful because it exposes the concentration behind the headline.
For buyers, the lesson is to distinguish a launch-driven weekly spike from the wider comparison. A busy opening weekend and the following week are different stages of a project’s sales cycle. Neither snapshot can tell you whether the exact remaining unit is appropriately priced.
CCR: ten units, led by Dunearn House and Newport Residences
| Project | Units |
|---|---|
| Aurea | 1 |
| Draycott 8 | 1 |
| Dunearn House | 2 |
| Midtown Bay | 1 |
| Newport Residences | 2 |
| River Modern | 1 |
| The Residences At W Singapore Sentosa Cove | 1 |
| The Robertson Opus | 1 |
| CCR total | 10 |
Dunearn House and Newport Residences record two units each. The other six listed CCR developments record one apiece, taking the regional total to ten. That is six more units than the previous compilation’s CCR count of four.
This is still a small weekly sample. It would be premature to infer a broad prime-market price movement from it. Buyers comparing Aurea, River Modern, The Robertson Opus or The Residences At W Singapore Sentosa Cove should assess the exact home, total price and intended use.
Location labels are only a starting point. Compare floor-plan function, tenure, occupation timing and the practical daily journey. A two-unit result can be worth noting, while the purchase decision still needs a current quotation and a realistic alternative.
RCR: Union Square Residences leads a broader spread
| Project | Units |
|---|---|
| Arina East Residences | 3 |
| Bloomsbury Residences | 1 |
| Canninghill Piers | 1 |
| Hudson Place Residences | 2 |
| One Marina Gardens | 3 |
| Promenade Peak | 3 |
| Terra Hill | 3 |
| The Arcady At Boon Keng | 1 |
| The Ranz | 1 |
| The Sen | 2 |
| Union Square Residences | 7 |
| RCR total | 27 |
Union Square Residences contributes seven units, or approximately 25.9% of the RCR’s 27-unit total. Arina East Residences, One Marina Gardens, Promenade Peak and Terra Hill contribute three units each. Together, these five projects account for 19 of the region’s 27 units.
The RCR total is two units above the previous week’s 25, although the distribution across projects has changed. That offers a different reading from the large decline in the overall headline: this supplied city-fringe tally is slightly higher, while Lucerne Grand’s OCR launch contribution is much smaller.
For a city-fringe shortlist, compare what the total price buys in actual living space and convenience. Bloomsbury Residences, Hudson Place Residences, The Sen and The Arcady At Boon Keng belong in different household comparisons depending on location, layout and timing. Use the floor-plan guide to assess the individual unit rather than choosing by weekly rank.
OCR: Lucerne Grand leads with 11 units
| Project | Units |
|---|---|
| Canberra Crescent Residences | 1 |
| Chuan Park | 3 |
| Coastal Cabana | 2 |
| Elta | 1 |
| Kassia | 2 |
| Lentor Gardens Residences | 1 |
| Lucerne Grand | 11 |
| Narra Residences | 3 |
| Skies Miltonia | 1 |
| The Lakegarden Residences | 1 |
| OCR total | 26 |
Lucerne Grand contributes 11 of the OCR’s 26 units, approximately 42.3% of the region’s count and 17.5% of the residential total. Chuan Park and Narra Residences follow with three units each, while Coastal Cabana and Kassia record two apiece.
The other OCR projects contribute 15 units combined, compared with 24 excluding Lucerne Grand in the previous list. This nine-unit reduction is partly offset at the overall non-Lucerne level by the higher CCR and RCR totals. Those are separate observations, and they should be kept visible when interpreting the week.
A smaller post-launch tally does not establish that a development has lost its appeal or that prices have changed. The compilation does not supply remaining inventory, unit-specific prices, cancellations or buyer profiles. For Lucerne Grand, read the launch-results analysis alongside current balance-unit information.
Commercial and industrial: two units separately
| Project | Units |
|---|---|
| Gate+ | 1 |
| Smart Food @ Mandai | 1 |
| Commercial & Industrial total | 2 |
Gate+ and Smart Food @ Mandai each contribute one unit in the supplied compilation. Their combined two units are kept outside the residential regional breakdown. Commercial and industrial property decisions involve different uses and considerations, so they should not be mixed into the 63-unit residential headline without explanation.
Sean’s reading of the week
My main takeaway is that the headline comparison is heavily affected by Lucerne Grand’s launch-week contribution. This week’s supplied list has a more even split between RCR and OCR, with a higher CCR count. That is a description of the recorded activity, rather than a forecast of future prices.
If you are buying, use the tally to organise further research. Ask for the exact price, stack, floor and available layout, then compare two or three alternatives at a similar total budget. High sales do not automatically make every unit attractive, and a low weekly count does not automatically make a home a bargain.
For an upgrader, confirm the sale budget and purchase timeline together. Start with the affordability calculator, discuss your current home through Sell with Sean, and compare resale homes with new launches. The buyer checklist can keep the comparisons consistent.
For broader context, read the Q3 2026 private-property price update. Weekly project counts and quarterly price indices measure different things; neither establishes the value of a particular apartment.
Frequently asked questions
Is the total 63 or 65 units?
The residential total is 63. The two commercial and industrial units are additional, making 65 across all categories in this supplied compilation.
Did the headline fall because all projects sold much less?
The supplied lists do not support that conclusion. Lucerne Grand accounts for 337 of the 338-unit difference; the residential totals excluding it are 53 and 52. The lists’ coverage and changing project rosters also need to be considered.
Which region recorded the most residential units?
The RCR records 27 units, just ahead of the OCR’s 26. The CCR records ten. These are counts within the supplied weekly list.
Sources and methodology
Project counts and regional groupings are reproduced from the weekly project-sales compilation supplied to Sean See for 5–11 October 2026. The previous-week comparison uses the supplied 28 September–4 October compilation reproduced in the previous weekly sales article for 28 September–4 October. Regional totals, shares and differences are calculated from those lists.
The original compilations’ transaction definitions and completeness have not been independently verified. These updates are not presented as URA’s monthly developer-sales statistics or a complete count of Singapore property transactions. Project names link to existing pages on this website where available. Current prices and availability should be checked separately.